⚡ The Problem & Why It Mattered To Me
I spent my yearlong travel sabbatical using Polarsteps to journal my thoughts, photos and location each day. When I got back, I wanted to keep those memories safe in a format I could still open 10, 20, 30 years from now. Most apps don’t last that long. So I requested my data from Polarsteps. What I got were JSON files, packed with deeply nested lists that were anything but user-friendly. That’s when I decided to write this script, to pull out the journal entries and turn them into something more usable. And of course, I went the little extra mile to plot the countries I travelled to on a map 😊.
⚡ TL-DR
A single Python script that:
- Extracts every journal entry & location from Polarsteps’ export.
- Saves them as future proof text files (one per entry + monthly & full year DOCX).
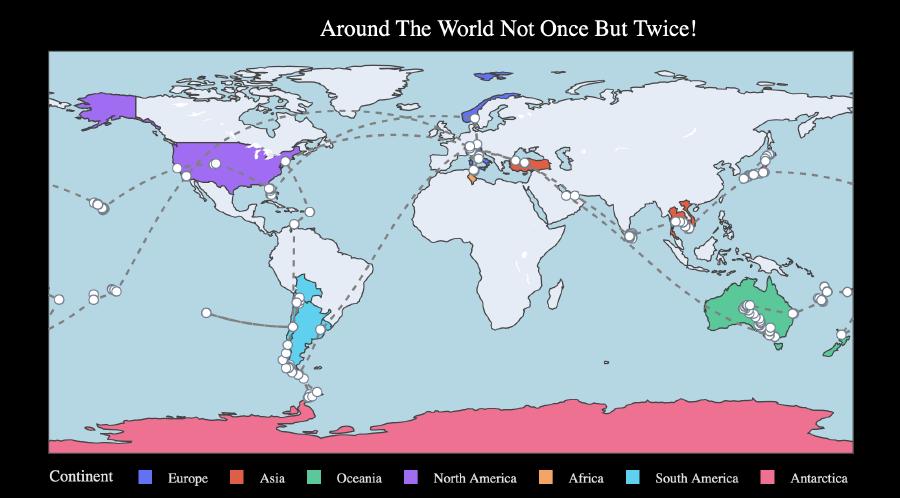
- Plots the entire route on an interactive Plotly map served with Dash.
Run it once, get a clean archive, no copy paste.
🛠️ Approach (data flow)
Polarsteps Export
└─ locations.json + trips.json
↓
Python parser
↓
Output 1: Text Files of Journal Entries
Output 2: Plotly Travel Map
Core libraries: json, pandas, plotly, dash, python-docx
📚 Things I Learned
- Taming nested JSON with list comprehensions.
- First hands-on with Plotly Express & Dash for quick web visuals.
🤯 Most Challenging
Nested JSON felt like Russian doll chaos, every list hid another list.
I eventually learned about list comprehension which flattened the mess without 100 lines of loops.
🚀 If I Had Infinite Time…
- Add a slick basemap (e.g., satellite or watercolor style) so the plotted route sits on more eye catching background tiles.
- Animate the journey so the path “replays” day by day.
🐙 Full code on GitHub here.